
Track LLM spend like cloud spend or repeat cloud history
OpenTelemetry's GenAI conventions finally standardize token and cost telemetry. Instrument now or meet your bill the way we all met AWS bills, screaming.
cat contents.txt
Cloud cost management became an industry because nobody tagged anything in 2015. LLM spend is speedrunning the same arc: one shared API key, no attribution, and a finance person asking which team owns the six-figure line item. The answer, historically, is a shrug that costs more than my car.
The tooling excuse just expired.
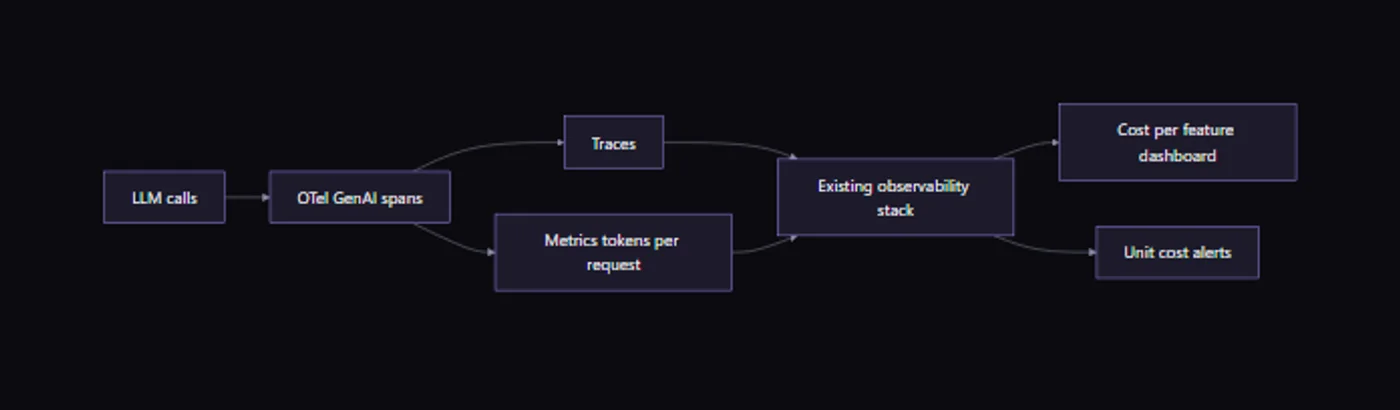
OpenTelemetry's GenAI semantic conventions
standardize the attributes that matter: gen_ai.request.model,
gen_ai.usage.input_tokens, gen_ai.usage.output_tokens, finish
reasons, tool calls. The
OTel blog walkthrough
covers agent spans and content capture, and platforms are adopting the
conventions natively,
Datadog among them.
Instrument once, point the exporter wherever you already look at
graphs.
the four tags that answer every finance question
Feature, team, model, environment. Attach them to every span. "Which feature costs the most" and "what did the migration to the small model actually save" become queries instead of archaeology.
watch unit costs, not totals
Total spend going up might be growth, which is fine and even encouraged. Cost per request going up is a regression: a prompt that grew, a retry loop gone feral, a cache that quietly stopped hitting (the caching math only works when reads happen). Alert on tokens per request per feature. Totals are for the CFO; unit costs are for you.
the three alerts that have paid rent
After a year of tuning, my alert file is down to three that have each caught something real. Tokens per request per feature, week over week: catches the growing prompt, the new retriever stuffing more chunks, the teammates who added "just one more" example to the few-shot block. Retries per request: the feral loop alert, which once caught a client library retrying on a 400, forever, at full price, because someone mapped the wrong status codes. And cache hit rate on anything cached: the silent killer, since a cache that stops hitting does not error, it just bills. All three are ratios. Ratio alerts survive traffic growth; absolute alerts cry wolf every product launch.
The forecast question ("what will this cost at 10x users") stops being scary with the same instrumentation: unit cost per feature times projected volume, plus the retry and cache terms you now actually know. I have watched that arithmetic kill two features before launch, which sounds sad and was in fact the system working. Cheaper to learn in a spreadsheet than in production.
getting it adopted, the political footnote
The instrumentation is a day of work. Getting five teams to actually attach the four tags is a quarter of nagging, unless you cheat the way platform teams have always cheated: make the tagged path the easy path. Ship a thin client wrapper that sets the attributes from the service's own config, reject untagged requests at the gateway in dev (warn in prod, for now), and publish the weekly spend-by-team chart where everyone eats lunch. Nobody tags for compliance. Everybody tags the week their mystery spend shows up as "unattributed" on a chart their director reads. The chart does the management for you, which is the only management strategy I have ever seen scale.
And keep one honest line on that chart for the untagged remainder. Watching it shrink from 60 percent to 4 is the entire program's progress bar, and the last 4 percent is always the internal tool someone swore was decommissioned. It was not decommissioned. It is never decommissioned.
the trap
Do not build a bespoke cost tracker. The conventions exist precisely so LLM telemetry flows through the observability stack you already run. A special snowflake dashboard is one more thing that rots; a span attribute is forever.
tags: #observability #cost #tooling